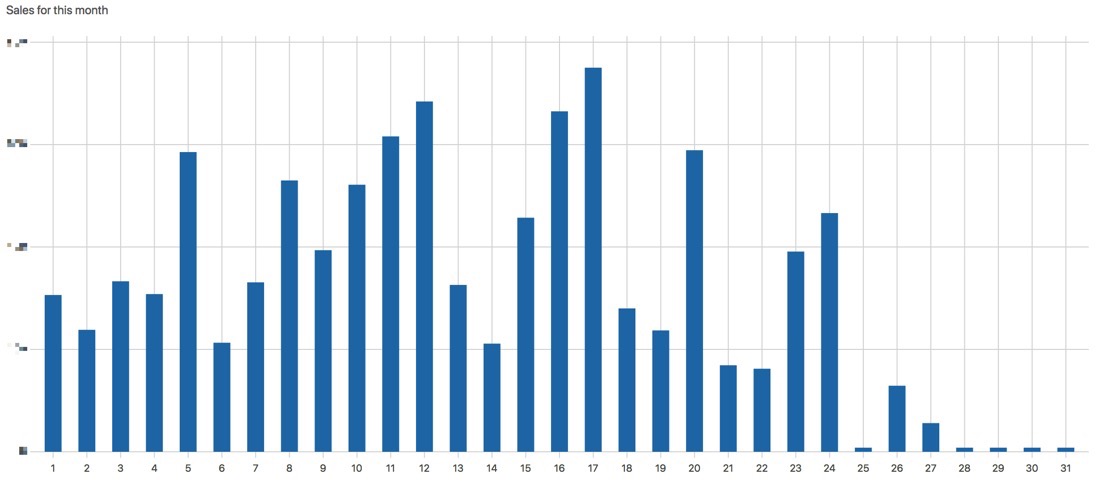
I have a reporting backend for my book/video business that has one chart which I stare at every day: the daily sales:

I use Google Analytics religiously, but it’s not reliable for ecommerce because ad blockers will also block Google Analytics so a number of sales simply aren’t recorded.
Anyway: I need to roll my own reporting if I want to see anything of substance, which is fine as love playing with PostgreSQL. When you do that, however, you run into some interesting problems. Such as this one:

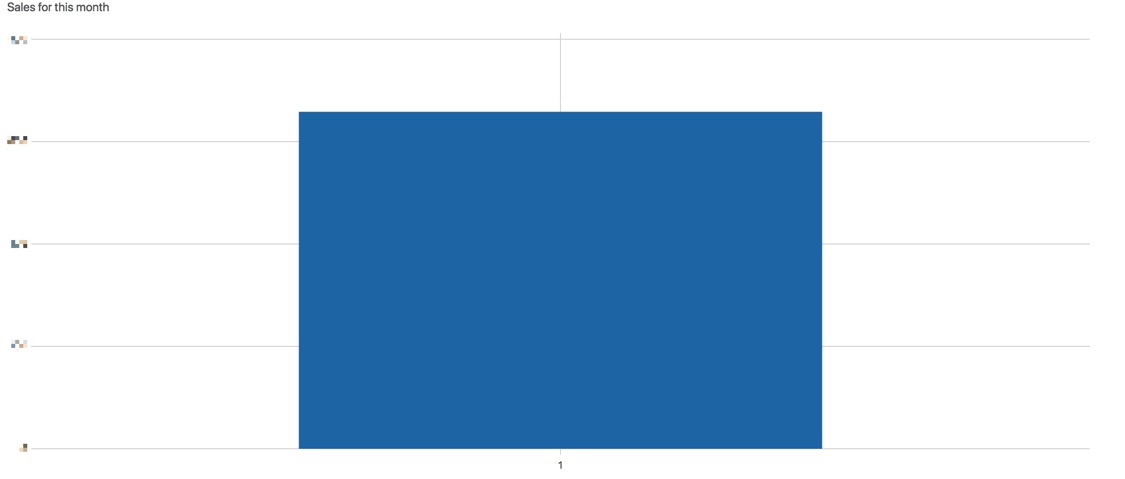
Today is the first day of the month, so the chart only has a single value and the formatting is completely off. In fact it’s off every day! This has been bugging me for a while, so today I decided to fix that.
Generating a Series of Dates
The problem is straightforward: I need to see all the days in a given month. PostgreSQL has extensive date functions, but nothing (that I’ve seen) that will just spit out the dates in a given month.
To get around this, I’ll rely on an old friend: generate_series.
There’s no surprise with this function, it does what you might expect, creating a logical series from a seed and bound:
rob=# select * from generate_series(1,10);
  generate_series
-----------------
               1
               2
               3
               4
               5
               6
               7
               8
               9
              10
(10 rows)
You can also add a step with a third argument:
rob=# select * from generate_series(1,10,2);
 generate_series
-----------------
               1
               3
               5
               7
               9
(5 rows)
This is where things get usefully mindblowing: it also works with dates and intervals:
rob=# select * from generate_series(now(), now() + '5 days', '1 day');
    generate_series
-------------------------------
 2018-08-01 14:10:52.380404-07
 2018-08-02 14:10:52.380404-07
 2018-08-03 14:10:52.380404-07
 2018-08-04 14:10:52.380404-07
 2018-08-05 14:10:52.380404-07
 2018-08-06 14:10:52.380404-07
(6 rows)
Interval syntax is one of the things I absolutely love about working with PostgreSQL and dates. I know that many people don’t like arbitrary strings to represent something, but I think you can probably get over that with the obvious “1 day” syntax, don’t you think?
Generating a Series of Days Within a Month
The easiest thing to do is to pass in dates for the start and end of the month:
select * from generate_series(
    '2018-08-01'::timestamptz,
    '2018-08-31'::timestamptz,
    '1 day'
);
That works as expected, but it’s cumbersome. This is where PostgreSQL can help us with some date functions. What I need is to “round down” the month to day one, and I can do that using a date_trunc, which truncates a date to a specified precision:
rob=# select date_trunc('month',now());
       date_trunc
------------------------
 2018-08-01 00:00:00-07
(1 row)
I can use this same trick to get the last day of the month, using interval syntax:
rob=# select date_trunc('month',now()) + '1 month'::interval - '1 day'::interval as end_of_month;
      end_of_month
------------------------
 2018-08-31 00:00:00-07
(1 row)
That looks nuts, doesn’t it? Here’s what’s happening:
- the
date_truncfunction is returning atimestamp with time zone(ortimestamptz) - I am then incrementing that
timestamptz, which is2018-08-01 00:00:00-07by a month, making it2018-09-01 00:00:00-07 - I don’t want the start of September, I want a single day before that, so I decrement it by a day using
- '1 day'
That’s that. I can now plug this into generate_series:
select * from generate_series(
    date_trunc('month',now()),
    date_trunc('month',now()) + '1 month' - '1 day'::interval,
    '1 day'
) as dates_this_month;
Which returns every date, in order:
...
 2018-08-25 00:00:00-07
 2018-08-26 00:00:00-07
 2018-08-27 00:00:00-07
 2018-08-28 00:00:00-07
 2018-08-29 00:00:00-07
 2018-08-30 00:00:00-07
 2018-08-31 00:00:00-07
(31 rows)
Turning Our Date Range Into a Usable Table
I could plug this SQL into a bigger query and use it straight away, but it’s way too useful for that. Let’s wrap it with a function, shall we? That way we can pass in whatever date or month we want to use:
-- this is
create function dates_in_month(the_date timestamptz=now())
returns table(the_date date) as $$
select d::date from generate_series(
    date_trunc('month',the_date),
    date_trunc('month',the_date) + '1 month' - '1 day'::interval,
    '1 day'
) as series(d);
$$
language sql;
A few things to note:
- I’m defaulting
the_dateparameter to today’s date for convenience - You can send in any date, and the month of that date will be used in the function
- I’m casting the series return as a
datebecause that’s what it is; atimestamptzhere is useless - To cast that, I need to alias the function to explicitly return it’s inline value (
d)
This works great:
rob=# select * from dates_in_month();
  the_date
------------
 2018-08-01
 2018-08-02
 2018-08-03
 ...
 2018-08-28
 2018-08-29
 2018-08-30
 2018-08-31
(31 rows)
Now I just need to use it in a sales query.
Joining Things Together To Produce The Chart
I have a view in my database called sales_fact that sums up the order totals, their count, and expresses the dates in a number of ways. Here it is:
create view sales_fact as
  select sum(total) as sales,
  count(1) as sales_count,
  created_at::date as sales_date,
  date_part('year',created_at at time zone 'hst') as year,
  date_part('quarter',created_at at time zone 'hst') as quarter,
  date_part('month',created_at at time zone 'hst') as month,
  date_part('day',created_at at time zone 'hst') as day
from orders
group by orders.created_at
order by orders.created_at
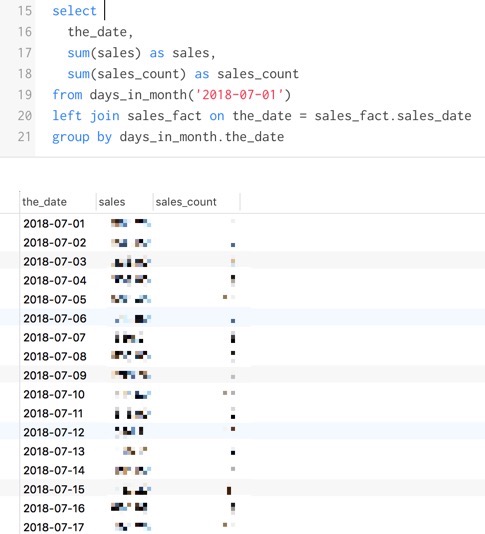
I want to join those numbers to my date series so I can have every day represented in my chart, not just a fat blue blob. To do that, I can use a simple left join:
select
  the_date,
  sum(sales) as sales,
  sum(sales_count) as sales_count
from days_in_month()
left join sales_fact on the_date = sales_fact.sales_date
group by days_in_month.the_date
Boom. Works great:

PostgreSQL is a joy to work with, and solutions to common problems are often right around the corner.